Live chat metrics cover three things: how available you are, how well the conversations go and what they deliver. On top of that, the conversations themselves tell you something no dashboard shows: where visitors get stuck and what they are missing on your website. If you only track the number of chats per month, you see only a small part of the picture.
What can you measure with live chat?
Measuring live chat means collecting figures across three layers: availability, the conversation and the result. Each layer answers a different question. Are you there when a visitor asks something? Do they get a good answer? And does the conversation lead to an enquiry, appointment or sale?
Alongside those figures there is a fourth source: the content of the conversations. It tells you which questions keep coming back, which information is missing from your website and which products people are looking for. That is qualitative information, but often the most useful.
What live chat is and how it works is covered in a separate article. Here the question is whether your chat delivers anything, and how you show that.
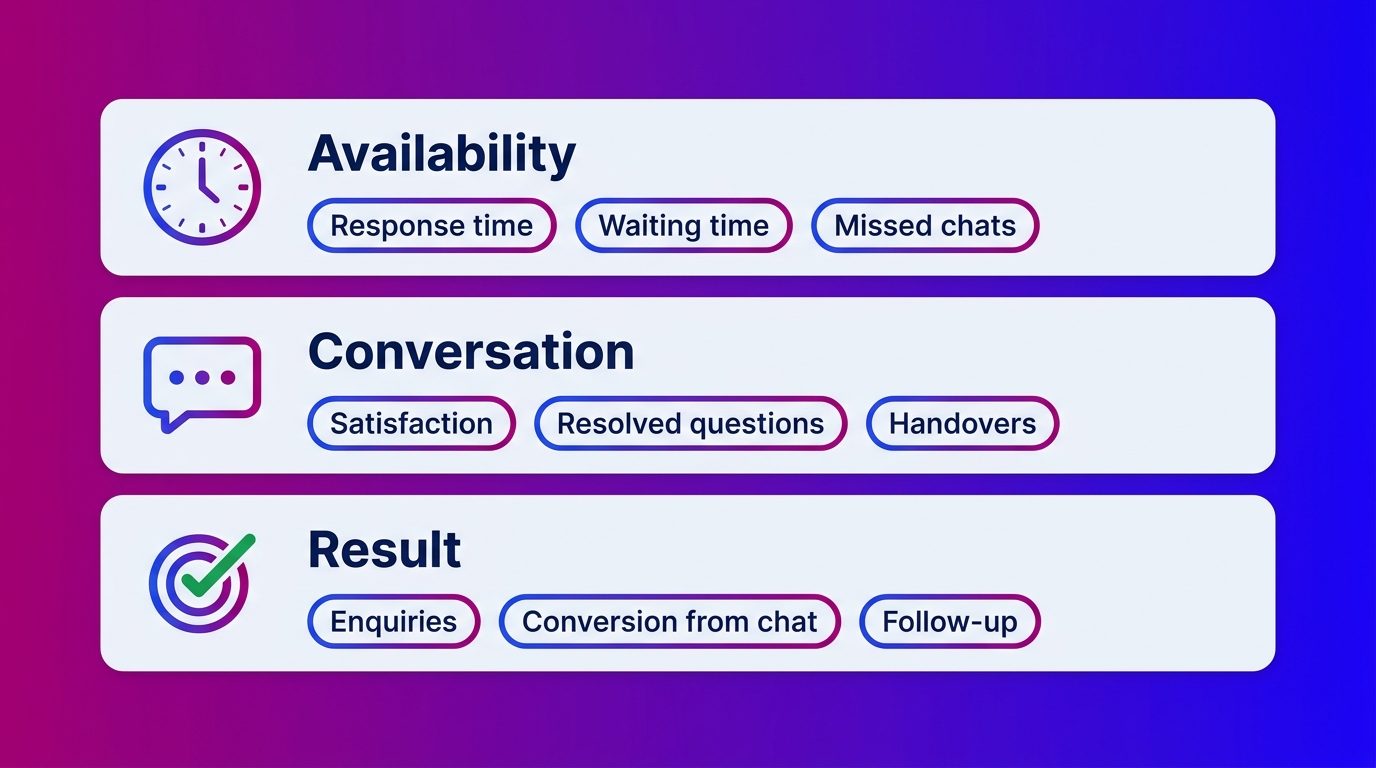
Availability: are you there when someone asks?
The first layer measures whether your chat does what it promises: answer straight away. A chat window that only responds after ten minutes is no different from a contact form for the visitor.
The main figures in this layer:
- Response time (pick-up time): how long it takes before a visitor gets the first answer.
- Waiting time: how long visitors queue at busy moments.
- Missed chats: conversations that were started but never answered, for example in the evening or at the weekend.
- Chats per day and per hour: when visitors ask most, so your staffing matches.
Look especially at the spread across the week. Many businesses only discover by measuring how many questions come in outside office hours. That is exactly where opportunities are lost, because nobody answers.
The conversation: does the visitor get a good answer?
The second layer measures the quality of the conversations. Responding quickly does little good if the answer is wrong or the visitor drops out halfway.
- Customer satisfaction: a short rating at the end of the conversation.
- Resolved questions: the share of conversations completed in the chat itself.
- Handovers: how often a conversation is passed on, from AI to a chat specialist or to your own team.
- Drop-offs: conversations in which the visitor stops before their question is answered.
Always read these figures together. A high number of resolved questions is only good if satisfaction rises with it. And a handover is not a failure: with a complex question, passing it on with the right context is exactly what should happen.
If you use AI in the chat, its own figures come on top, such as how many questions the AI handles on its own. You can read more about that in chatbot metrics.
Result: what do the conversations deliver?
The third layer shows whether chat contributes to revenue. This is the layer marketing and sales managers ask about, and the one most often missing from reports.
- Enquiries and leads: how many conversations end in a quote request, appointment or test drive.
- Conversion from chat: the share of chat conversations that becomes a lead.
- Starting page of the chat: on which pages conversations start and which pages produce the most enquiries.
- Follow-up: how quickly a lead is called back and how many leads become customers.
The last point often falls outside the chat figures, but it determines the outcome. A good lead that sits for three days delivers little. That is why it pays to look at chat and follow-up together, so you get more return from your chat conversations instead of just more conversations.
How to use the chat itself to get more visitors to convert is covered in increasing conversions with live chat. How to turn conversations into qualified enquiries is in leads from live chat.
What chat conversations teach you about your website and range
Chat conversations are ongoing customer research. Visitors type literally what they are looking for, what they do not understand and why they hesitate. Four kinds of insight stand out.
Where visitors get stuck
The moment someone starts a chat says a lot. On that page the visitor is stuck, or they are convinced and want confirmation. By tagging conversations by page, you see which of the two it is and where your website can improve.
Which questions keep coming back
Questions that come back often are apparently not on your site, or not clearly. Use them to add to your frequently asked questions or improve a product page.
What is missing from your range
Do visitors repeatedly ask about a version, size or service you do not offer? That is a signal for purchasing or product development. Complaints and compliments also give direction.
Which campaigns produce real conversations
If you connect the chat to your web analytics, you see through which campaign or channel visitors arrived before they started chatting. That way you see not just clicks, but which campaign leads to a conversation and an enquiry.
Connecting live chat to Google Analytics and your CRM
Separate chat figures only become truly useful when you connect them to the rest of your data. Two integrations make the difference.
Google Analytics 4. Send starting a chat and leaving contact details to GA4 as events. Then mark the enquiry as a key event. According to Google, you can then see how many visitors perform that action and through which channels they arrived. That way you compare chat with your forms and see which pages and campaigns produce conversations.
Your CRM or support system. Have every lead arrive with the full conversation attached. Then your sales team sees what the visitor already said, and you can later check which chats became customers.
Pay attention to privacy rules when measuring. Under the UK’s PECR rules, the ICO expects consent for analytics and tracking cookies, so set up your measurement in line with your cookie banner.
What we look at in reports at Bconnect
At Bconnect we always look at service and results together in reports. A fast pick-up time only means something alongside the question of how many of those conversations became a lead.
In Bconnect Analytics, a client sees the conversations, qualified leads, handovers and appointments per period. They also see which pages convert well and how many questions were handled automatically. Every lead arrives with the transcript, by email, in the support system or in the CRM, so the sales team knows what the conversation was about.
What we often see in practice: clients look at the number of chats first and only later at the content. Yet that is where the gains are. With an analysis of the topics in the conversations, we gather insights for the website, the range and recurring customer questions. Our account managers use them to adjust scripts, lead criteria and the balance between people and AI.
Measure in order to steer
Measuring live chat is not a report card, but a steering wheel. Start with the three layers: are you available, do the conversations go well and do they deliver anything? Then connect the chat to GA4 and your CRM, so you see which conversations become customers. And read the conversations themselves regularly, because they show what visitors are missing on your website.
Frequently asked questions about live chat metrics
What can you measure with live chat?
You measure availability (response time, waiting time, missed chats), the quality of the conversation (satisfaction, resolved questions, handovers) and the result (enquiries, conversion and the page where the chat starts). On top of that, the conversations teach you what visitors are missing on your website.
Which live chat metrics matter most?
That depends on your goal. If you want more leads, look mainly at the number of enquiries and the conversion from chat. If it is about service, response time, resolved questions and satisfaction matter more. Always look at the figures together.
Can you connect live chat to Google Analytics?
Yes. You send, for example, starting a chat and leaving contact details to Google Analytics 4 as events. Mark the enquiry as a key event, and you see through which channels and pages chats lead to enquiries.
What is a good response time in the chat?
The faster, the better: a visitor expects an answer straight away in a chat. Alongside the average, look at the busiest moments and at evenings and weekends, because that is where waiting times rise most often.
How do you measure whether live chat produces leads?
Count how many conversations end in an enquiry, appointment or test drive and divide that by the total number of chats. Then follow in your CRM how many of those enquiries become customers. Only then do you see what chat really delivers.
How do you get improvement points from chat conversations?
Tag conversations by topic and by the page where they start. Questions that come back often point to missing information. Pages with many chats and few enquiries point to a place where visitors get stuck.
How often should you review the chat figures?
In the first months after starting, look every week so you can adjust quickly. Once the chat runs steadily, a monthly report is usually enough. Also read back a number of conversations regularly.